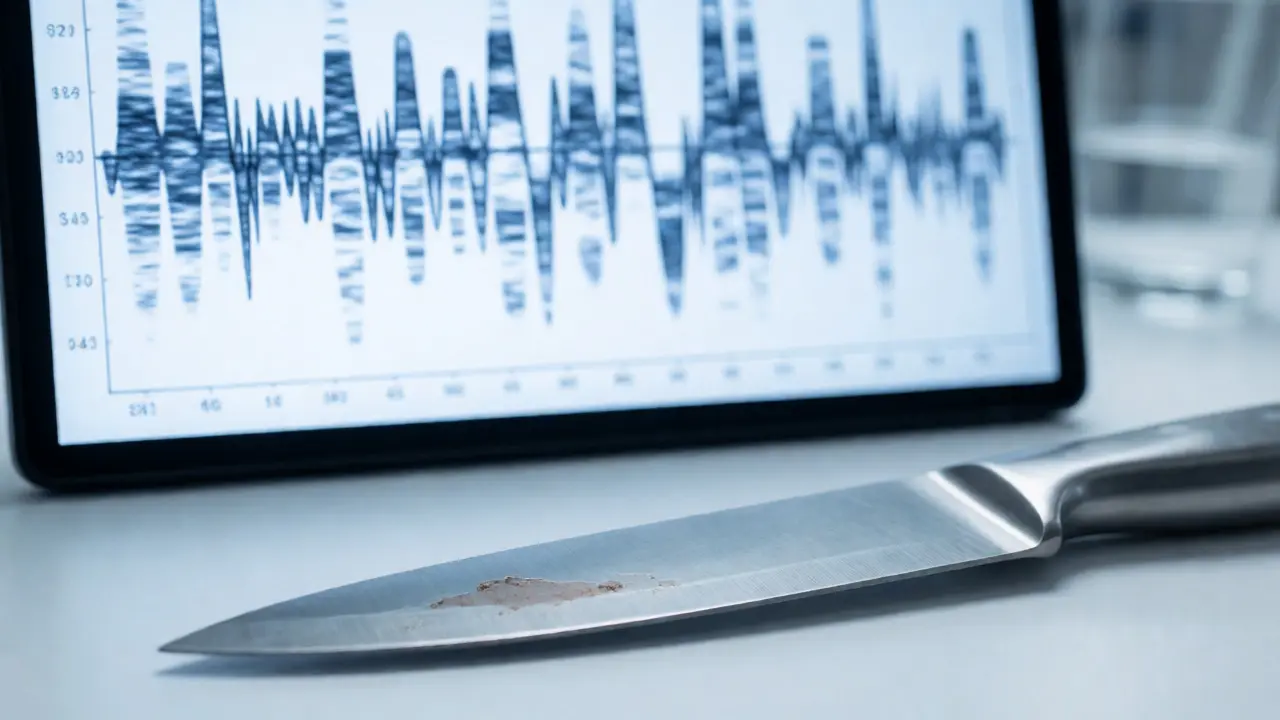
Imagine finding a blood stain on a kitchen knife. It looks like one person's crime scene evidence, but under the microscope, it’s a chaotic blend of three different people's genetic profiles. For decades, forensic scientists stared at these DNA mixtures and relied on gut feeling or rigid rules to figure out who was involved. That approach is changing. Today, we use sophisticated mathematical models called deconvolution methods to untangle these biological knots with statistical precision.
If you work in criminal justice, study biology, or just love true crime documentaries, understanding how we separate mixed DNA samples is crucial. It’s not magic; it’s math applied to molecules. This guide breaks down exactly how deconvolution works, why traditional methods fell short, and what tools labs are using right now to keep up with complex cases.
The Challenge of Mixed DNA Samples
A single-source DNA sample is straightforward. You have one contributor, and their Short Tandem Repeat (STR) profile shows two peaks at each genetic marker-one from mom, one from dad. But life isn’t that clean. When two or more people leave biological material together-say, during a struggle-their DNA mixes. The resulting electropherogram becomes a jumble of overlapping peaks.
Traditional interpretation used a method called "exclusion." Analysts would look for alleles present in the suspect but absent in the mixture. If the suspect had an allele the mixture didn't, they were excluded. Simple, right? Not really. This method fails when contributors share alleles. It also struggles massively with low-template DNA, where stochastic effects cause random dropouts or drop-ins. In a three-person mixture, manual interpretation often hits a wall. The analyst has to guess which peak belongs to whom, introducing subjectivity into a field that demands objectivity.
What Is Probabilistic Genotyping?
This is where Probabilistic Genotyping (PG) enters the picture. Unlike binary yes/no decisions, PG uses Bayesian statistics to calculate the likelihood of competing hypotheses. Instead of asking "Is this person included?", it asks "How much more likely is it that this person contributed to the mixture compared to a random unrelated individual?"
Think of it like noise-canceling headphones for genetics. The software doesn't just look at peak heights; it models the entire process of PCR amplification and capillary electrophoresis. It accounts for stutter peaks, baseline noise, and degradation. By running millions of simulations, it determines the most probable combination of genotypes that could produce the observed data.
| Method | Approach | Subjectivity Level | Best Use Case |
|---|---|---|---|
| Manual/Congruent | Visual inspection against guidelines | High | Simple 2-person mixtures with clear separation |
| Continuous Model | Uses all peak height data via Bayesian stats | Low | Complex mixtures, low template, degraded samples |
| Semi-Continuous | Hybrid of manual rules and limited stats | Moderate | Labs transitioning from manual methods |
Leading Deconvolution Software Tools
You can't do this math by hand. You need specialized software. As of 2026, three major platforms dominate the forensic landscape in the United States and Europe. Each has its own quirks and strengths.
- STRmix: Developed by Scientific Systems, Inc., this tool uses a continuous model based on Markov Chain Monte Carlo (MCMC) algorithms. It’s highly regarded for its transparency and ability to handle complex, multi-contributor mixtures. Labs appreciate that it provides detailed reports showing the probability distributions behind every decision.
- TrueAllele: Originally from Geospiza (now part of Promega), TrueAllele was one of the first commercial PG systems. It uses a similar Bayesian framework but has faced some scrutiny regarding validation studies in recent years. It remains widely used due to established case law precedents.
- DNAmixtures II: An open-source alternative gaining traction in academic settings and smaller labs. While less feature-rich than commercial giants, it offers flexibility for researchers developing new statistical approaches without licensing fees.
Choosing between them isn't just about price. It’s about validation. The FBI’s Quality Assurance Standards require rigorous internal validation before any lab adopts a new tool. This involves testing known mixtures to ensure the software produces accurate likelihood ratios consistently.
The Role of Likelihood Ratios
The output of deconvolution isn't a simple match percentage. It’s a Likelihood Ratio (LR). This number compares two propositions:
1. The prosecution hypothesis: The suspect contributed to the mixture.
2. The defense hypothesis: A random unknown person contributed instead.
If the LR is 1,000, it means the DNA evidence is 1,000 times more probable if the suspect is a contributor than if they aren't. Crucially, this does not mean there is a 99.9% chance the suspect did it. It’s a measure of evidentiary strength, not guilt. Misinterpreting LRs as probabilities of guilt is a common error in courtrooms. Lawyers must explain this distinction clearly to juries, often relying on expert testimony to bridge the gap between statistics and legal reasoning.
Validation and Quality Control
Software alone doesn’t guarantee accuracy. Garbage in, garbage out applies here too. If your input parameters are wrong, your results will be misleading. Labs follow strict protocols defined by organizations like the Scientific Working Group on DNA Analysis Methods SWGDAM.
Key steps include:
- Threshold Setting: Determining the minimum peak height considered reliable signal versus noise.
- Stutter Modeling: Calibrating the software to recognize artifacts caused by polymerase slippage during PCR.
- Number of Contributors (NoC): Estimating how many people are in the mix before running the algorithm. Most software allows analysts to specify NoC, but advanced tools can estimate it automatically.
- Blind Testing: Having analysts interpret samples without knowing the expected answer to check for bias.
In Portland, local labs adhere to state-specific accreditation standards alongside federal guidelines. Regular proficiency tests ensure that even after software updates, the human element remains sharp. Remember, the software suggests; the scientist decides.

Common Pitfalls in Mixture Analysis
Even with powerful tools, errors happen. Here are the most frequent issues I’ve seen in practice:
- Overfitting: Assuming too many contributors than actually exist. This can create false positives by forcing rare alleles into the model.
- Underestimating Degradation: Older samples lose longer fragments. If the model assumes intact DNA, it might misinterpret skewed peak heights.
- Ignoring Relatives: Close family members share more alleles than random strangers. Standard population frequency databases don’t account for this well, potentially inflating LRs in familial searches.
- Contamination: Modern high-sensitivity kits pick up trace amounts of DNA from handlers or previous samples. Without careful negative controls, contamination can look like a minor contributor.
To mitigate these risks, always review the raw data. Don’t blindly trust the final LR. Look at the fit statistics provided by the software. If the model poorly explains certain loci, investigate why. Was there a dropout event? Did the sample degrade unevenly?
The Future of DNA Deconvolution
We’re moving toward fully automated workflows. Next-generation sequencing (NGS) is starting to enter forensics, offering more markers than traditional capillary electrophoresis. NGS can distinguish between identical repeat lengths, adding another layer of resolution to mixtures. However, integrating NGS data into current PG software is still in development phases.
Another trend is machine learning. Some newer algorithms are training neural networks on vast datasets of simulated and real mixtures to predict contributor numbers and genotypes faster. While promising, the black-box nature of deep learning poses challenges for courtroom admissibility. Judges prefer explanations they can understand, so interpretable AI models may win out over pure performance metrics.
What is the difference between a mixture and a single-source sample?
A single-source sample comes from one individual, showing a maximum of two alleles per genetic marker. A mixture contains DNA from two or more individuals, resulting in more than four alleles across the profile and overlapping peaks that require deconvolution to interpret.
Can deconvolution software determine the exact number of contributors?
Not always with certainty. Most software requires the analyst to specify the number of contributors (NoC) or provides a probability distribution for possible NoCs. Complex mixtures with shared alleles make exact determination difficult, so analysts often test multiple NoC scenarios to find the best fit.
Why are likelihood ratios preferred over inclusion/exclusion?
Inclusion/exclusion is binary and ignores peak height information. Likelihood ratios utilize all available data, including peak heights and quality metrics, providing a graded measure of evidentiary weight. This reduces subjectivity and allows for comparison of evidence strength across different cases.
How long does it take to analyze a complex DNA mixture?
The computational time varies. Simple runs might take minutes, while complex mixtures with many contributors using MCMC algorithms can take hours or even days depending on the hardware. However, the total turnaround time includes manual review, validation checks, and reporting, which usually adds several days to the process.
Is probabilistic genotyping accepted in all courts?
Widely, but not universally. Most US states accept validated PG software under Daubert or Frye standards. However, specific jurisdictions may have pending appeals or unique rulings. Defense attorneys frequently challenge the proprietary nature of some algorithms, demanding access to source code for independent verification.