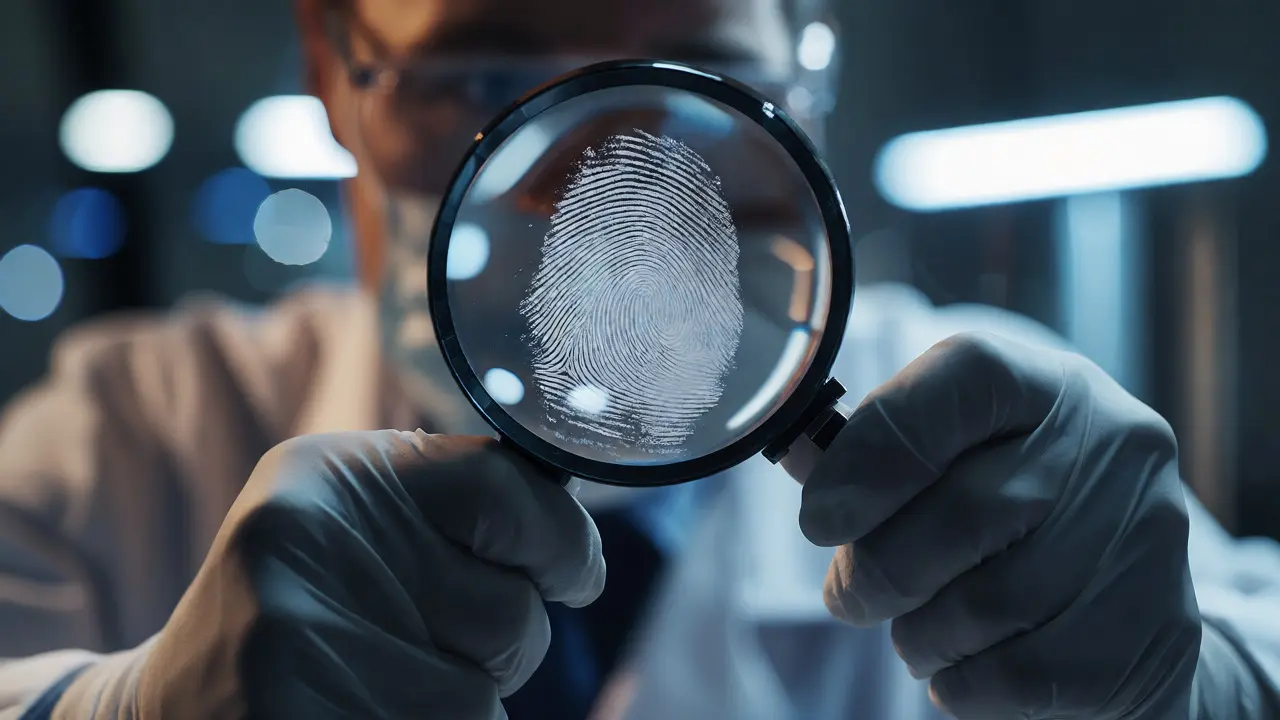
Imagine you're a detective. You find a smudge on a glass at a crime scene. A lab tech compares it to a suspect's prints and says, "It's a match." Case closed, right? Not so fast. For decades, fingerprint identification was treated as infallible-the gold standard of forensics. But recent research has cracked that golden veneer, revealing that fingerprint error rates are real, measurable, and sometimes higher than we'd like to admit.
This isn't about saying fingerprints are useless. They're still one of our best tools. But understanding where they fail helps us use them better. If you work in law enforcement, run a lab, or just care about justice, you need to know what the data actually shows. Let's break down the numbers, the reasons behind them, and what they mean for real-world cases.
The Myth of Infallibility
We grew up watching TV shows where a single thumbprint solved the mystery instantly. The idea that no two fingerprints are alike is true. But matching a blurry, partial print from a crime scene to a clean inked print on a card is hard. It involves human judgment. And humans make mistakes.
The National Institute of Standards and Technology (NIST) and other bodies have spent years trying to quantify this. Before around 2015, most labs claimed error rates were near zero. Today, controlled studies suggest the reality is more nuanced. False positives-where an examiner wrongly identifies a match-do happen. So do false negatives, where a valid match is missed. Knowing the difference matters because a false positive can put an innocent person in jail, while a false negative lets a guilty person walk free.
What Do Controlled Studies Actually Show?
You might ask, "How do researchers measure something so subjective?" They run blind tests. Examiners don't know if the prints match or not. They don't know which is the 'target' and which is the 'decoy.' This removes bias.
A landmark study by NIST in 2019 analyzed data from over 600 examiners across different agencies. Here’s what they found regarding false positive rates:
- Experienced Examiners: Had lower error rates, often below 1% in ideal conditions.
- Less Experienced Examiners: Error rates could climb to 5-10% depending on print quality.
- High-Quality Prints: When ridge detail was clear, errors dropped significantly.
- Low-Quality/Latent Prints: Errors spiked. Smudges, overlapping ridges, and poor contrast made mistakes common.
Another key finding came from the FBI’s own internal reviews after high-profile misidentifications, such as the Brandon Mayfield case in 2004. That case, where a Spanish citizen was wrongly linked to the Madrid train bombings based on a latent print, forced a national reckoning. Post-Madrid studies showed that even top-tier federal examiners had error rates higher than previously advertised when working under time pressure or with ambiguous evidence.
Why Do Mistakes Happen? The Role of Cognitive Bias
It’s not just bad eyesight. It’s psychology. Forensic examiners are susceptible to cognitive biases, just like everyone else. Two types stand out:
- Confirmation Bias: If an investigator tells the examiner, "We think it’s Suspect X," the examiner may unconsciously look for features that support that theory and ignore discrepancies.
- Contextual Bias: Knowing too much about the case-like whether the suspect confessed-can skew interpretation.
The ACE-V method (Analysis, Comparison, Evaluation, Verification) was designed to mitigate this. Analysis should happen before comparison. But in practice, these steps often blur. A 2020 study published in the Journal of Forensic Sciences highlighted that verification steps sometimes rubber-stamp initial conclusions rather than independently challenging them.

Quality Matters More Than Experience
Here’s a counterintuitive insight: experience doesn’t always beat quality. A novice looking at a crystal-clear print will likely succeed. An expert squinting at a muddy smudge might fail. Research consistently shows that latent print quality is the strongest predictor of accuracy.
| Print Quality Level | Description | Estimated Error Rate Range |
|---|---|---|
| High | Clear ridge flow, distinct minutiae, minimal distortion | < 1% |
| Moderate | Some smudging, partial ridge visibility, moderate contrast | 2% - 5% |
| Low | Heavy smudging, fragmented ridges, low contrast, noise | 8% - 15%+ |
Labs are now investing heavily in better collection techniques. Using chemical enhancements, digital imaging with higher resolution, and proper lighting during collection reduces the burden on the examiner later. If you’re collecting evidence, remember: garbage in, garbage out. No amount of expertise fixes a print collected badly.
The Impact of Automation and AI
Automated Fingerprint Identification Systems (AFIS) are everywhere. They search databases quickly. But AFIS doesn’t identify; it proposes candidates. Humans still make the final call. Does automation help or hurt?
Research suggests a mixed bag. On one hand, AFIS reduces workload, potentially lowering fatigue-related errors. On the other, it can create "automation complacency." Examiners might trust the system’s top candidate too much. A study involving police departments using modern AFIS found that while processing speed increased, the rate of overlooked matches in complex searches remained steady. The technology is a tool, not a replacement for critical thinking.
Emerging AI algorithms are getting better at pattern recognition. Some deep learning models claim to reduce false positives by filtering out non-matches more aggressively. However, these systems lack transparency. If an AI says "match," can it explain why? Often, no. This "black box" problem remains a hurdle for courtroom admissibility.
Standardizing How We Report Errors
One big issue in the field is inconsistency. Lab A might report an error rate of 0.5%, while Lab B reports 3%. Are they different labs, or are they measuring differently? Many labs define "error" loosely. Some only count blatant mismatches. Others include inconclusive results where the examiner hesitated.
The Scientific Working Group on Friction Ridge Analysis, Study and Technology (SWGFAST) provides guidelines, but adoption varies. To improve reliability, labs need to adopt standardized metrics. Reporting should distinguish between:
- False Positives: Incorrectly identifying a non-match as a match.
- False Negatives: Failing to identify a true match.
- Inconclusive Results: Correctly determining that there isn’t enough information to decide.
Treating inconclusive results as failures skews data. Sometimes, the right answer is "I don't know." Encouraging examiners to say that without fear of penalty improves overall accuracy.
Practical Steps for Better Accuracy
If you manage a lab or work in investigations, here’s how you can apply these insights today:
- Blind Verification: Ensure the verifier doesn’t know the original examiner’s conclusion. This breaks confirmation bias.
- Document Everything: Record every step of the ACE-V process. If you discard a feature, write down why. This creates an audit trail.
- Continuous Training: Use proficiency tests regularly. Don’t wait for annual audits. Simulate difficult, low-quality prints.
- Improve Collection: Train first responders on proper lifting techniques. Better raw data leads to fewer downstream errors.
- Peer Review: Implement routine peer reviews of completed cases, especially those leading to arrests.
These steps aren’t just bureaucratic red tape. They directly address the psychological and technical roots of error. A 2023 survey of accredited labs showed that those implementing strict blind verification protocols saw a 15% reduction in disputed identifications over two years.
Frequently Asked Questions
Are fingerprint error rates higher than DNA error rates?
Generally, yes. DNA analysis is highly automated and statistical, with very low error rates when handled correctly. Fingerprinting relies heavily on human visual comparison, making it more susceptible to subjective error and bias. However, both methods can suffer from contamination or mishandling.
Can a false positive fingerprint match lead to a wrongful conviction?
Absolutely. High-profile cases like Brandon Mayfield’s show that a mistaken identity can lead to detention and legal battles. While juries often trust forensic evidence, awareness of error rates is growing, encouraging defense attorneys to challenge fingerprint testimony more rigorously.
Does experience guarantee fewer errors in fingerprint analysis?
Not necessarily. While experienced examiners tend to perform better, studies show that cognitive bias affects experts too. In fact, confidence can sometimes be inversely correlated with accuracy in difficult cases. Standardized protocols matter more than years on the job.
What is the ACE-V method?
ACE-V stands for Analysis, Comparison, Evaluation, and Verification. It is the standard protocol used by fingerprint examiners. Analysis involves examining the latent print for quality. Comparison looks for similarities and differences. Evaluation determines if it’s an identification, exclusion, or inconclusive result. Verification is a second examiner reviewing the work.
How does print quality affect identification accuracy?
Quality is the primary driver of accuracy. High-quality prints with clear ridge detail yield error rates below 1%. Low-quality prints with smudging or fragmentation can push error rates above 10%, regardless of the examiner's skill level. Proper collection techniques are critical to maintaining quality.