When a crime scene yields a male DNA sample, forensic scientists don’t just look at the profile-they look at the population. Not just any population, but the specific group the suspect likely comes from. That’s where Y-STR databases come in. These aren’t just collections of DNA data. They’re statistical engines that help answer one of the toughest questions in forensics: How rare is this profile?
What Exactly Is a Y-STR?
The Y chromosome is passed down almost unchanged from father to son. Unlike autosomal DNA, which mixes from both parents, the Y chromosome stays mostly the same across generations. That makes it perfect for tracing paternal lines. But it also means that many men in the same paternal lineage will have nearly identical DNA profiles. So how do you tell one man from another?
That’s where Y-STRs come in. These are Short Tandem Repeats on the Y chromosome-small, repeating sequences of DNA that vary in length between individuals. Labs test anywhere from 11 to 27 of these markers. Each marker can have dozens of different values. Put them together, and you get a Y-STR haplotype-a unique pattern that can help distinguish one male lineage from another.
But here’s the catch: if two men share the same haplotype, it doesn’t mean they’re brothers. They might just share a common ancestor from hundreds of years ago. That’s why databases matter. Without knowing how common or rare a haplotype is in a given population, a match could mean anything-or nothing.
The Global Gold Standard: YHRD
The most trusted source for Y-STR frequency data is the Y-Chromosome STR Haplotype Reference Database, or YHRD. Managed by the University of Frankfurt, YHRD pulls together data from over 1,000 population studies worldwide. As of 2026, it holds more than 349,750 minimal haplotype records. That’s not just numbers-it’s real-world diversity.
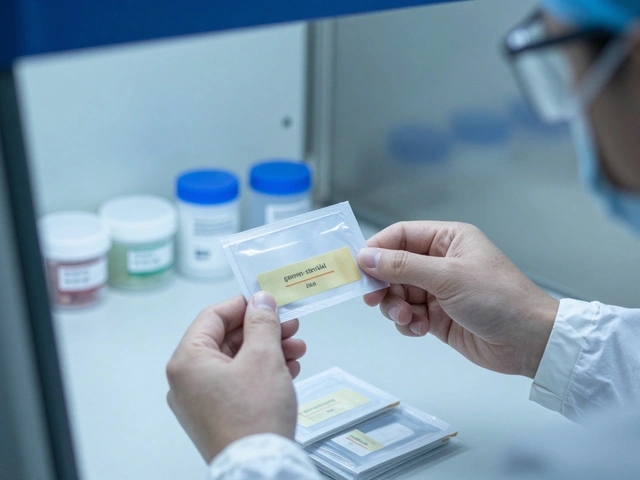
Inside YHRD, you’ll find detailed breakdowns: 309,090 records for Y12 markers, 289,405 for Y17, 106,444 for Y27, and even 46,773 for Ymax-the full set of 27 loci. There’s also data from Y-SNPs, which help pinpoint deeper ancestral origins. These aren’t just stored randomly. Each record is tagged with geographic origin, ethnicity, and testing method. That lets forensic analysts pull the right comparison group.
For example, if a DNA sample from a sexual assault case matches a Y-STR profile, the lab doesn’t just search the whole database. They narrow it down. If the suspect is believed to be of African descent, they pull only African-American haplotypes. Same for Asian, Hispanic, or Caucasian populations. This precision matters because haplotype frequencies vary wildly across groups.
How the U.S. Database Works
The United States runs its own Y-STR database, built through collaboration between the National Center for Forensic Science, Promega, Applied Biosystems, ReliaGene, and the University of Arizona. It contains 13,906 haplotypes, each tested across 11 to 17 loci. The data is split into five key ancestral groups: African-American, Asian, Caucasian, Hispanic, and Native American.
Let’s look at Oregon’s data. In a study of 47 African-American men from Oregon (labeled AOR), researchers found 46 unique haplotypes out of 47 samples. That’s a haplotype diversity of 0.999. What does that mean? It means if you pick two random men from that group, there’s a 99.9% chance they’ll have different Y-STR profiles. That’s incredibly high.
For European-American men in Oregon (EOR), 35 samples yielded 33 unique haplotypes. Diversity? 0.997. Still very high. But here’s the key: in some populations, diversity drops. In a group of 31 Louisiana European-American men, only 29 unique haplotypes were found. That’s still good-but not as strong as Oregon’s sample.
Why does this variation exist? Because of history. Migration, isolation, marriage patterns, and population bottlenecks all shape how DNA is passed down. A haplotype common in Texas might be rare in Pennsylvania. That’s why you can’t use a national average. You need local, population-specific data.
The Kedayan Case: A Global Snapshot
Back in 2024, a study of 128 unrelated Kedayan men from Sabah, East Malaysia, gave forensic science a new benchmark. Using the Powerplex Y23 kit, researchers tested 23 Y-STR loci. They found 92 different haplotypes-but 72 of them were unique to just one person each. That’s a discriminating capacity of 0.719. In plain terms: if you had a crime scene sample from this population, you’d be able to rule out nearly 72% of unrelated men just by the profile.
The match probability? 0.015. That means if you randomly picked a Kedayan man off the street, there’s only a 1.5% chance he’d match the crime scene profile. That’s not as rare as a fingerprint, but in forensic terms, it’s strong. Especially when you consider how few men were sampled.
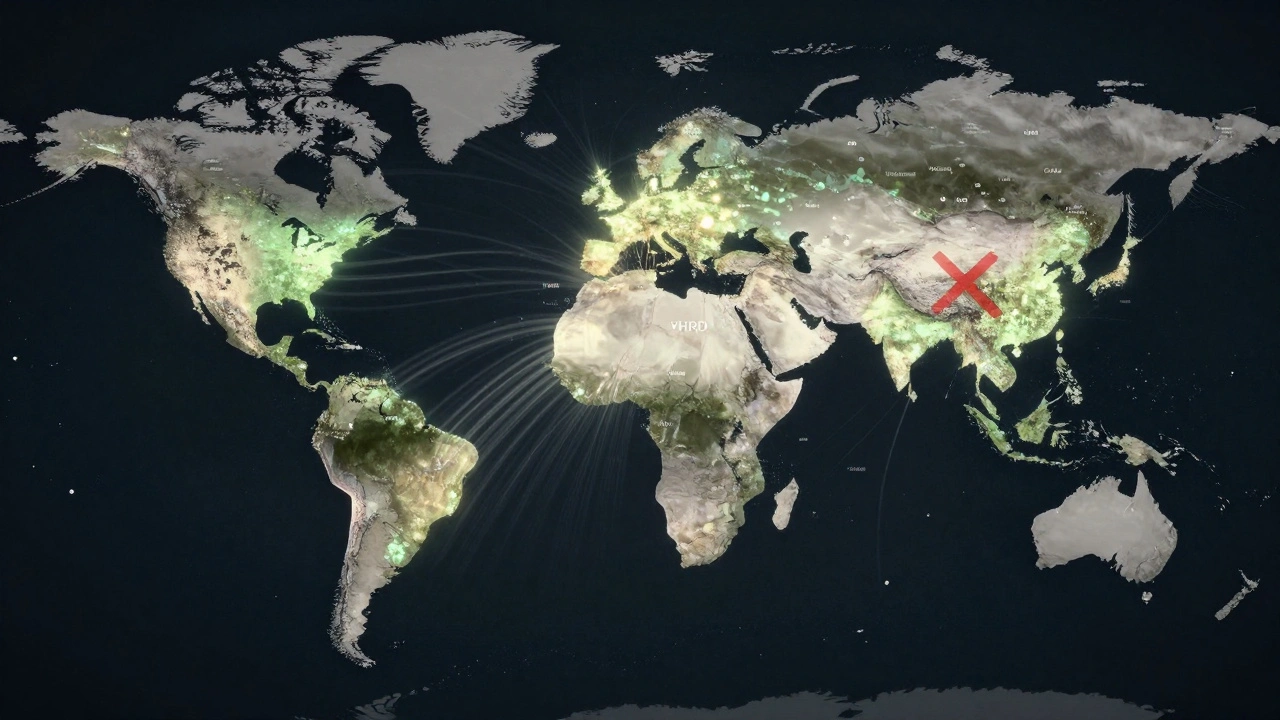
This data was added to YHRD under accession number YA004621. Why? Because it fills a gap. Most Y-STR databases are heavy on European and North American data. But Asia, Africa, and Indigenous populations are underrepresented. Every new dataset like this makes global forensic analysis more accurate.
Statistical Weight: What It Really Means
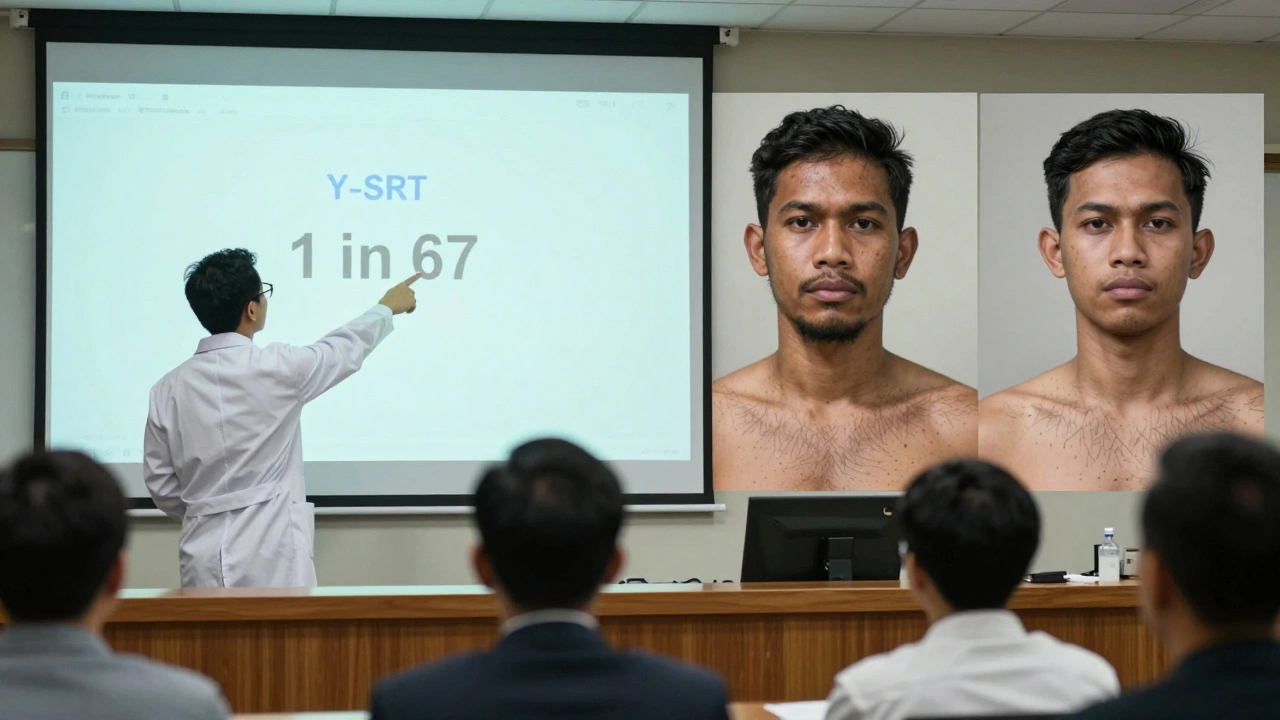
Forensic reports don’t say, “This DNA matches.” They say, “The probability of another random individual from this population having this profile is 1 in 67.” That number? It comes from the database.
Three key stats drive this:
- Haplotype diversity: Measures how many unique patterns exist in the group. Values between 0.989 and 1.000 mean the system is working well. Below 0.95? Red flag.
- Discriminating capacity: The percentage of individuals you can tell apart. In the Kedayan study, it was 71.9%. That’s high. In some small, isolated groups, it can drop below 50%.
- Match probability: The chance that a random person matches the profile. A value of 0.015 means 1 in 67. A value of 0.001 means 1 in 1,000.
These aren’t guesses. They’re calculated using rigorous formulas based on sample size, allele frequencies, and population structure. And they’re only as good as the data behind them.
Why Data Quality Matters
In 2023, YHRD removed all Mainland Chinese Y-STR records. Why? Because the data collection methods didn’t meet international standards. Some samples were mislabeled. Others came from small, non-representative groups. One study claimed to have 500 samples from Beijing-but only 30 were truly unrelated. That’s not science. That’s noise.
Forensic labs can’t afford to use bad data. A match probability based on flawed numbers could wrongly convict someone-or let a guilty person walk free.
That’s why labs follow strict rules. The Scientific Working Group on DNA Analysis Methods (SWGDAM) says: if your evidentiary sample has 17 loci, you must search the database using all 17. If you only have 12, you can’t use a database with 27 loci. You must match the loci you have. No shortcuts.
Y-STR vs. Autosomal DNA
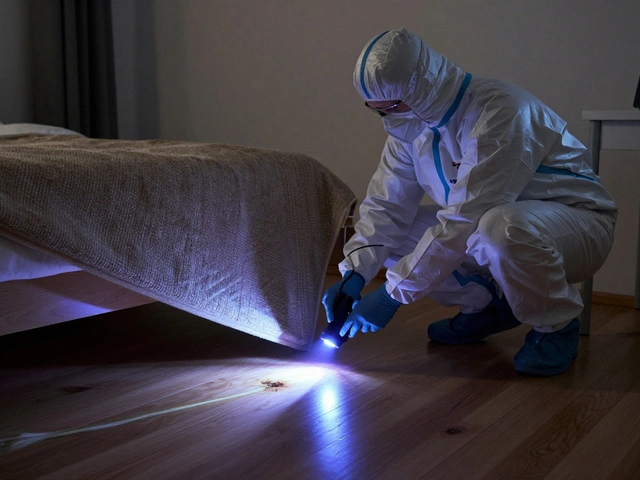
Autosomal DNA (from all 22 non-sex chromosomes) is great for identifying individuals. But it’s messy in cases with multiple contributors-like a sexual assault with more than one male suspect. Y-STRs cut through the noise. They only show the male DNA. That’s why they’re used in rape kits, missing persons cases involving paternal relatives, and mass disaster identification.
But Y-STRs can’t replace autosomal DNA. They’re not individual identifiers. They’re lineage identifiers. Think of them as a family name, not a fingerprint. You need both to get the full picture.
What’s Missing?
Despite progress, Y-STR databases are still incomplete. Indigenous populations in North America, Pacific Islanders, and many African groups are still underrepresented. Even within the U.S., Native American data is sparse. Without it, match probabilities for these groups are estimated from neighboring populations-leading to potential errors.
And then there’s the issue of migration. A man from Somalia living in Portland might have a Y-STR profile that’s common in East Africa but rare in the U.S. database. If the lab only uses U.S. reference data, they’ll overestimate how rare his profile is. That’s a real risk.
Researchers are working on it. Projects are underway to collect samples from underrepresented groups. But progress is slow. Every new dataset takes years to validate.
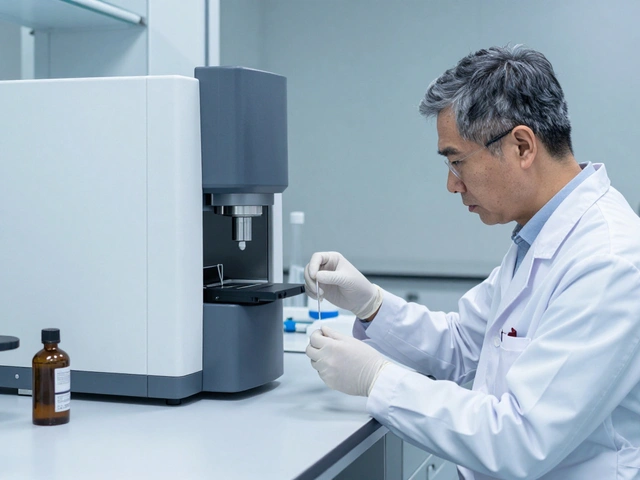
How Forensic Labs Use This Today
In 2026, most U.S. labs use the consolidated U.S. Y-STR Database for domestic cases and YHRD for international or mixed-ancestry cases. They don’t guess. They search. They report. And they cite the database used.
When a report says, “The match probability is 1 in 78,” it’s not a random number. It’s pulled from 13,906 verified samples. It’s backed by peer-reviewed studies. And it’s been checked against global data.
That’s the power of population data. It turns a DNA match from a vague clue into a quantifiable piece of evidence. And in court, that’s everything.