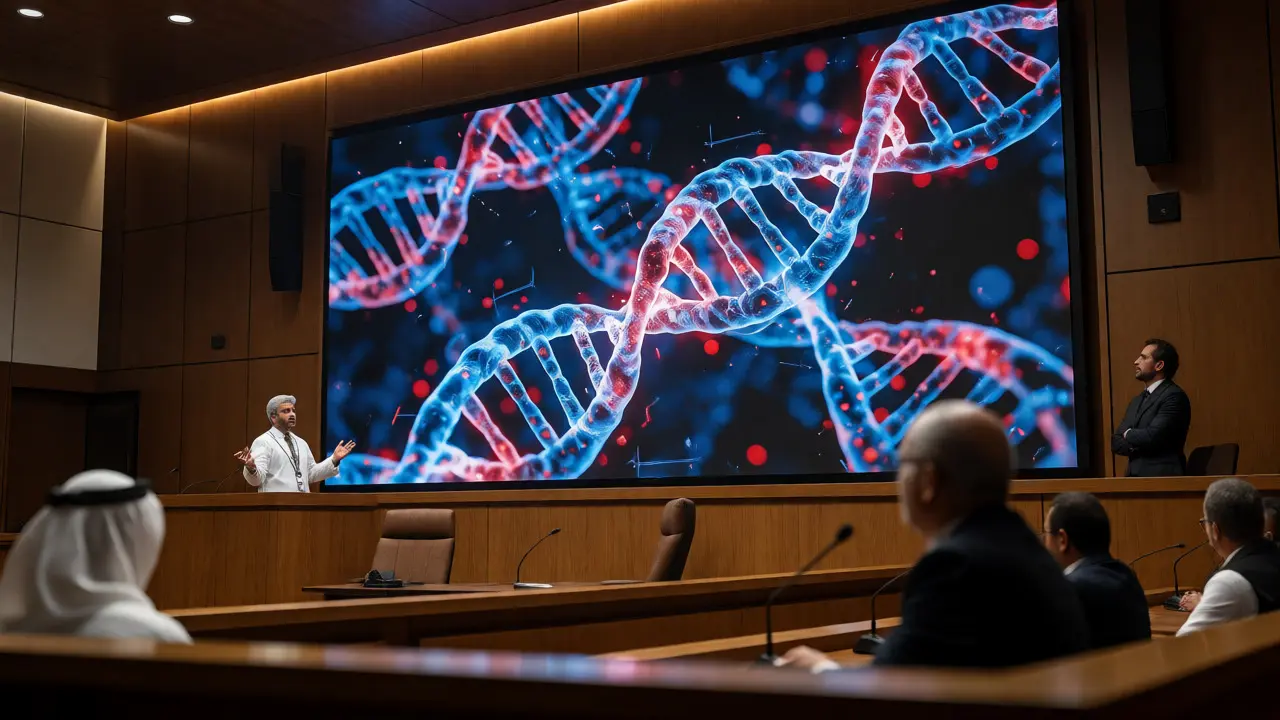
You’ve got a solid case. The lab results are clean. The chain of custody is unbroken. But then you stand up in court, pull out a slide showing a Random Match Probability of one in several billion, and you watch the jury’s eyes glaze over. It happens more often than you’d think. Jurors aren’t statisticians. They’re people trying to make sense of complex evidence while worrying about their lunch break or whether they left the stove on.
The gap between what a forensic scientist knows and what a juror understands is where cases are won or lost. If you can’t explain why that tiny number matters without sounding like a textbook, you might as well be speaking Latin. This isn’t about dumbing it down; it’s about translating precision into clarity. Here’s how to bridge that divide effectively.
The Core Problem: Why Numbers Confuse People
Human brains are terrible at processing extremely small probabilities. We don’t have an intuitive feel for "one in a trillion." It sounds impressive, sure, but does it mean anything concrete? Not really. When you tell a jury there’s a 0.000000001% chance someone else matches this DNA profile, their brain tries to convert that into something relatable. Often, they fail. They might assume it means the defendant is definitely guilty, or conversely, they might fixate on the fact that it’s not zero, ignoring the context entirely.
This cognitive bias is known as the prosecutor’s fallacy. It’s the confusion between the probability of the evidence given innocence (P(E|H)) and the probability of innocence given the evidence (P(H|E)). These are two very different things. A common mistake jurors make is thinking that if the chance of a random match is low, the chance of guilt must be high. That’s not how conditional probability works. Your job as the expert witness is to untangle this knot before the defense attorney ties it into a pretzel during cross-examination.
To help jurors grasp this, avoid starting with the final number. Start with the process. Explain how we build a profile from specific locations on the DNA strand, called STRs (Short Tandem Repeats). Each location has variations. By looking at enough of them, we create a genetic fingerprint unique to almost everyone on Earth-except identical twins. Once they understand the mechanism, the statistical weight becomes easier to accept because they see why the number is so small.
Choosing Your Statistical Framework: RMP vs. LR
There are two main ways to present DNA statistics: Random Match Probability (RMP) and Likelihood Ratio (LR). Both are valid, but they speak to different parts of the human reasoning engine. Most labs still default to RMP, but LRs are gaining traction because they frame the evidence in terms of support rather than absolute certainty.
RMP answers the question: "How likely is it that a randomly selected person from the population would match this DNA profile?" It gives you a single number, like 1 in 10 billion. It’s simple to state, but it lacks nuance regarding the alternative hypothesis. It doesn’t explicitly compare the prosecution’s theory against the defense’s.
Likelihood Ratio, on the other hand, compares two competing propositions. Proposition A: The suspect contributed the DNA. Proposition B: An unknown individual contributed the DNA. The LR tells you how much more probable the evidence is under A than under B. For example, an LR of 1,000,000 means the evidence is one million times more likely if the suspect is the source than if someone else is. This framing feels more natural to jurors because it mirrors how they weigh everyday decisions. "Is it more likely I locked the door, or did the wind blow it shut?" They’re used to comparing scenarios.
| Feature | Random Match Probability (RMP) | Likelihood Ratio (LR) |
|---|---|---|
| Question Answered | Chance of a random person matching | Strength of evidence supporting one hypothesis over another |
| Format | Single fraction (e.g., 1 in 5 billion) | Ratio (e.g., 5,000,000:1) |
| Juror Intuition | Hard to visualize scale | Easier to understand as comparative weight |
| Context Sensitivity | Does not account for prior evidence | Can incorporate other case facts |
If your jurisdiction allows it, lean toward LR. It forces you to address the defense’s argument directly. If the defense says, "It could have been anyone," the LR quantifies exactly how unlikely that "anyone" scenario is compared to the suspect being the source. It turns a static number into a dynamic argument.
Using Analogies Without Trivializing Science
Analogies are powerful tools, but they’re double-edged swords. Use them poorly, and you’ll look condescending. Use them well, and you’ll light up the room. The key is to choose analogies that preserve the magnitude of the probability while making it tangible.
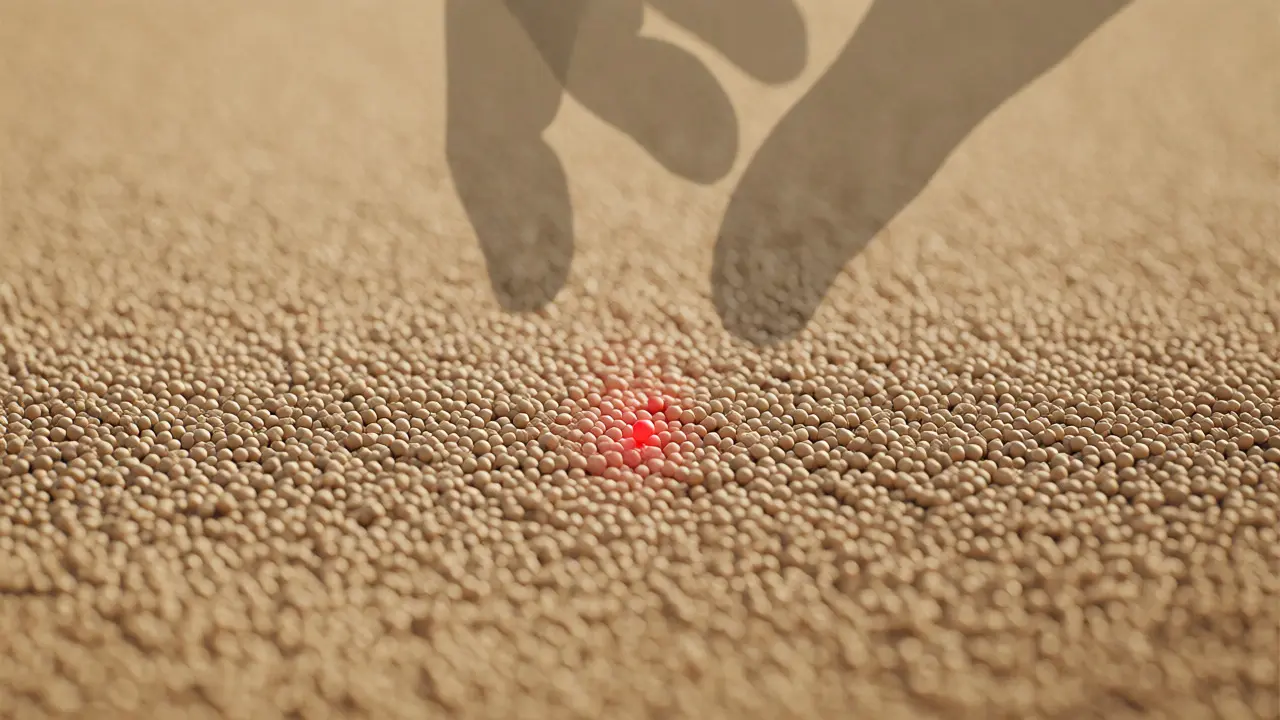
Consider the classic "grains of sand" analogy. Imagine filling a stadium with sand. Now, hide one red grain somewhere in that massive pile. Ask a juror to close their eyes and pick one grain at random. What’s the chance they pick the red one? Very low. This helps visualize a one-in-a-million chance. For larger numbers, like one in a trillion, you might say: "Imagine every person who has ever lived, plus everyone currently alive, standing in line. The chance of picking the right person by blindfolded guess is less than that."
Another effective method is the "coin flip" sequence. Flipping heads ten times in a row is rare (1 in 1,024). Flipping it twenty times is rarer still (1 in a million). DNA profiles require matching many more loci than twenty coin flips. So, saying "It’s like flipping heads thirty times in a row and getting heads every time" conveys the improbability better than just reciting digits.
Be careful with analogies involving lottery tickets or birthdays. The birthday paradox confuses people because it deals with shared dates among a group, not a specific target. Stick to independent events where the outcome is singular and distinct. Also, always circle back to the science after the analogy. Say, "Just as that red grain was uniquely identified, these genetic markers are uniquely matched to this sample."
Addressing the Defense’s Attacks Head-On
Defense attorneys love to attack the database frequency. They’ll ask, "Isn’t there a chance someone else in the world has this same profile?" Yes, technically. But the point isn’t that no one else exists; it’s that the odds of finding that person in this specific crime scene context are negligible.
When challenged on the Population Database used to calculate frequencies, explain that we use large, representative samples (like the FBI’s CODIS database) to ensure our estimates are conservative. If the database shows a marker appears in 1 out of 10 people, we don’t assume it’s 1 out of 9; we err on the side of caution. This conservatism strengthens your credibility. You’re not inflating the strength of the evidence; you’re protecting the defendant’s rights by underestimating the rarity.
Also, prepare for questions about mixture interpretation. If the DNA sample contains multiple contributors, the statistics get more complex. Don’t shy away from this. Admitting complexity builds trust. Explain that software algorithms separate the major and minor contributors, and the statistics reflect only the portion attributable to the suspect. If the minor contributor’s profile is weak, acknowledge that limitation. Jurors respect honesty more than false confidence.

Visual Aids That Actually Help
Slides with walls of text kill attention spans. Instead, use visual representations of the data. Show a bar chart of allele frequencies. Let jurors see that some markers are common (high bars) and others are rare (short bars). Then show how combining them multiplies the rarity.
A simple multiplication table graphic can be eye-opening. Show Marker A (1 in 10), Marker B (1 in 5), Marker C (1 in 20). Multiply them: 1 in 1,000. Add more markers, and the denominator explodes. Watching the number grow exponentially helps jurors intuitively grasp why the final statistic is so small. Avoid scientific jargon like "product rule" unless you define it immediately. Call it "stacking the odds" instead.
Color-code your exhibits. Make the suspect’s alleles blue and the reference sample red. Highlight the matches clearly. Visual alignment reinforces the logical connection. If you’re using LR, consider a balance scale graphic. On one side, put the evidence under the prosecution’s theory; on the other, under the defense’s. Show the scale tipping heavily toward one side based on the LR value.
The Final Check: Before You Leave the Stand
Before you step down, summarize your testimony in plain language. Restate the core finding: "The DNA found at the scene matches the suspect. The chance of this match occurring by random coincidence in an unrelated individual is approximately one in [X]. This means the evidence strongly supports the conclusion that the suspect contributed the biological material."
Watch the jury’s body language. If they look confused, offer a brief clarification. Don’t argue with the judge or opposing counsel. Stay calm, factual, and helpful. Remember, you’re not selling a verdict; you’re providing a tool for decision-making. If they understand the tool, they’ll use it correctly.
What is the difference between a match and an inclusion?
A match implies that the profiles are consistent with each other, but due to limitations in testing or mixture deconvolution, we may not have enough data to assign a precise random match probability. Inclusion means the suspect cannot be excluded as a contributor, but the statistical weight might be lower or undefined compared to a full match.
Why do we use likelihood ratios instead of just percentages?
Likelihood ratios provide a clearer comparison between two competing hypotheses (e.g., suspect vs. unknown). Percentages can be misinterpreted as the probability of guilt, which ignores prior evidence. LR focuses solely on how much the DNA evidence shifts the belief toward one hypothesis over the other, avoiding the base-rate neglect error.
How does the size of the database affect DNA statistics?
Larger databases provide more accurate estimates of allele frequencies. However, even with huge databases, we apply conservative adjustments to account for potential sampling errors. This ensures that the reported rarity of the profile is not overstated, maintaining fairness in the legal process.
Can identical twins have different DNA profiles?
Standard forensic DNA profiling (STR analysis) cannot distinguish between identical twins because they share nearly identical nuclear DNA. Specialized tests, such as whole-genome sequencing, might detect minor mutations, but standard courtroom DNA evidence usually treats identical twins as indistinguishable sources.
What if the DNA sample is degraded?
Degradation breaks DNA strands into smaller pieces, potentially losing information from larger markers. This can reduce the power of discrimination, leading to higher random match probabilities (less rarity). Experts will note this limitation and adjust interpretations accordingly, often relying on shorter amplicons or mitochondrial DNA if necessary.